Cyclograde lets you generate detailed elevation profiles built around your own speeds for your cycling tracks. The profile comes with you during your ride, in several formats. You can also export your track to your bike computer - with the places and the times worked out for that track. Cyclograde covers mainland France.
Create a track (elevation profile)
For a track of your own, you need the matching GPX file. Otherwise, have a look through the catalogue and see if a track takes your fancy. If you are not sure how to get hold of a GPX file, there are several ways:
From a platform you already use - Strava, OpenRunner, Garmin, Ride with GPS, and so on: just export your track as GPX.
From a route planning site - OpenRunner and others let you search for tracks and download the matching GPX file.
From sites that publish tracks - tourist offices, for instance, often offer ready-made GPX files.
No GPX file? Use a track from the catalogue
Cyclograde comes with a catalogue of tracks that are ready to use. It already holds the major sportives, and it will be updated regularly. All you have to do then is make the track you picked your own.
A GPX file holds the GPS data of your track (every point with its latitude and its longitude). It also holds elevation data, and sometimes timing data.
Sharpen your estimates with a custom speed profile
To estimate your time, Cyclograde uses a speed profile, which pairs a speed with every gradient. You don't ride at the same speed on the flat as you do dragging yourself up a pass at 8%... There are two ways to pick a speed profile:
You just give an average speed on the flat (25km/h, say) and Cyclograde works out the speeds for every gradient automatically
You build your own speed profile from what you actually ride. The times will be more accurate than with a generic profile, and truly matched to the rider you are.
To build a custom speed profile, you need a GPX file that contains time data - that is, a track you have already ridden and timed with your watch or your GPS computer.
You can create several profiles for your different paces, for example:
Short, hard ridesLong endurance ridesAll-out racing (time trials)
Create a track
The New track page is where you generate the elevation profile of a track. Here are the steps, one by one.
Get a GPX file ready
Pick the track you want to ride and get hold of a GPX file for it. You can export it from the activity platform you already use (Strava, Garmin, ...) or download it from a site that publishes routes (OpenRunner, Komoot, ...).
Select your GPX file
Click "Choose a GPX file" and select your GPX file. The name of the file you picked shows up in the box.
Name your track
Pick a descriptive name so you can find your track again easily in your list. For example: "Col du Galibier from Briançon" or "Tour de Chartreuse".
Choose a speed profile
To estimate your times on the track, Cyclograde uses a speed profile. The speed profile says how fast you ride at each gradient, which is what makes the time estimates reliable. 1) If you're signed up, you can use your own speed profiles by picking the Custom profile option (you need to create at least one speed profile first). 2) If you don't have a custom speed profile, pick a reference speed on the flat instead: the average speed you ride at on a route with no climbing and no descending (25 km/h, say). Cyclograde uses that average speed to work out a speed profile automatically. With a reference speed, the estimated times will match your real speeds less closely.
Choose the gradient model
The model sets how precisely the gradient colours are split. You have 3 models to choose from, from the simplest to the most detailed: 1) The "Simple" model uses only 3 colours, to tell climb, flat and descent apart 2) The "Detailed" model uses 9 colours, for a finer read on the gradients 3) The "Full" model offers 25 colours, for a very precise view of every percent of gradient
Choose a graph style
Each style uses different colours for the gradients. The information is exactly the same, only the colours change.
Choose the print format
The elevation profile generated for your track isn't just meant to be looked at on screen, it's meant to help you out on the ride. There are several ways to use it: 1) Download the profile as an image or a PDF and keep it on your phone so you can check it as you go 2) Print the PDF and take it with you. Several print-friendly formats are available, pick the one that suits you best. You can choose between "A4 sheet" to print on a standard sheet of paper, "smartphone" or "smartphone (portrait)" for an in-between format you can show on your phone or slot into a bike phone mount, or "sticker" for a compact format you can print on a sticker and stick on the top tube of your bike. Have a look at the Using your track profile out on the ride section to help you pick the format that works for you.
Choose the display options
By default, everything is shown on the elevation profile generated for the track. You can untick options if you want a simpler graph. Here are the options available: Places these are all the places found along the track: landmarks in towns, villages, ... If you untick this option, no place is shown on the profile, so you lose the recognisable landmarks along the way and the intermediate times with them (apart from the passes, which have their own option). Passes these are the mountain passes found along the track. Distance this is the distance shown for each place or pass found along the track. Estimated time this is the estimated time shown for each place or pass found along the track. Actual time this is the actual time shown for each place or pass found along the track. It only appears if the GPX file you upload holds time data. You can't show the estimated time and the actual time together. Climbs these are all the climbs found along the track, with the distance and the average gradient shown for each one. Statistics these are the main figures worked out for the track: distance, elevation gain, average speed.
Start generating
Click the Generate button to start building the elevation profile of your track. Generating takes anything from a few seconds to a minute or so. You can keep browsing the site, you'll get a notification when your track is ready. If you don't see any notification after a minute, you can always find your track on the tracks page.
For your first track, keep it simple: leave every option at its default
Show a track
The track page (the one you land on when you click the name or the profile of a track in your track list) shows you every detail of that track. You can see the elevation profile of the track, view the GPS track on a map, and see all the climbs that were found.
Track actions
The button bar gives you the following actions on the track: Profile: download the elevation profile as PDF or PNG, or print it straight away GPS track: download the track as GPX or TCX (to load onto your bike computer) Edit: change the places or the settings of the track Export: export the track to keep it on your computer (so you can import it again later) Delete: remove the track completely
Track details
You can look up all the information about your track: Statistics: the distance, the elevation gain, the total time and the average speed of the track. Elevation profile: the elevation profile for this track, which you can open full screen if you need to. GPS map: your track on a map with the places that were found, plus a mini profile that lets you place yourself on the map. Climbs: every climb detected automatically on the track, with its statistics.
Climbs on the track
Climbs are detected automatically on your track by analysing the changes in elevation. Each climb is graded by difficulty, from its length and its average gradient: Easy: gentle gradient, or a short climb. Moderate: a middling climb. Hard: a long climb, or a sustained gradient. Very hard: a demanding climb. Hors Catégorie: an exceptional climb.
For each climb you can look up its length, its elevation gain, its average gradient, its maximum gradient and the estimated time. Cyclograde keeps the climbs that are at least 1.5% gradient and 300m long, and for which gradient*distance > 3000 (a 300m climb at 10% is kept, while a 1.5% gradient has to run at least 2km to make the cut). Consecutive climbs count as one if they are less than 500m apart (in that case the part that does not go up is left out of the average percentage).
Using the track catalogue
The track catalogue offers ready-made tracks that you can make your own. You can browse the catalogue, pick a track and generate your own customised profile without needing a GPX file. The catalogue holds 2 kinds of track: open track and event. For event tracks such as sportives, the track also comes with the food stops. Food stops are coloured on the profile so you can spot them easily.
Browse the catalogue
The catalogue page lists every track available. You can filter them by type (open track or event) and by area (region, department). Each track shows its stats: distance, elevation gain and a preview of the elevation profile.
Pick a track
Click the "Choose" button to pick a track from the catalogue. You land on the customisation page, where you can set every option before generating your profile.
Customise your track
On the customisation page you set the same options as for a new track: name, speed profile, gradient model, style, print format and display options. The GPX file already comes with the catalogue track, so you don't have to upload one yourself.
Generate your own profile
Click "Generate the track's elevation profile" to create your customised profile. The track then shows up in your track list, just as if you'd created it yourself from a GPX file.
If you haven't got a GPX file to hand, or you're not sure where to find one, try a track from the catalogue to see what you can do with Cyclograde.
Sportive tracks are built from the data the organisers publish on their websites. A route can change at the last minute, or more precise details may go out only to riders who have signed up. I'd suggest checking that the Cyclograde track still matches just before your event. For instance, load the Cyclograde GPX file and the latest track from the organisers into OpenRunner on the same map, and check that they line up.
Understanding the elevation profile generated for a track
The elevation profile generated for your track carries a lot of information, useful when you prepare your ride and even more so while you're out on it. This section goes through every element shown on it.
What is an elevation profile?
An elevation profile of a track is a graph that plots the elevation of the track against distance, so you can see the climbs and the descents along the whole track at a glance. It's another way of looking at your track, easier to read than a map, and it puts the terrain front and centre. Above all, it can carry information like distance and time, which are hard to show on a map.
Explained in a picture
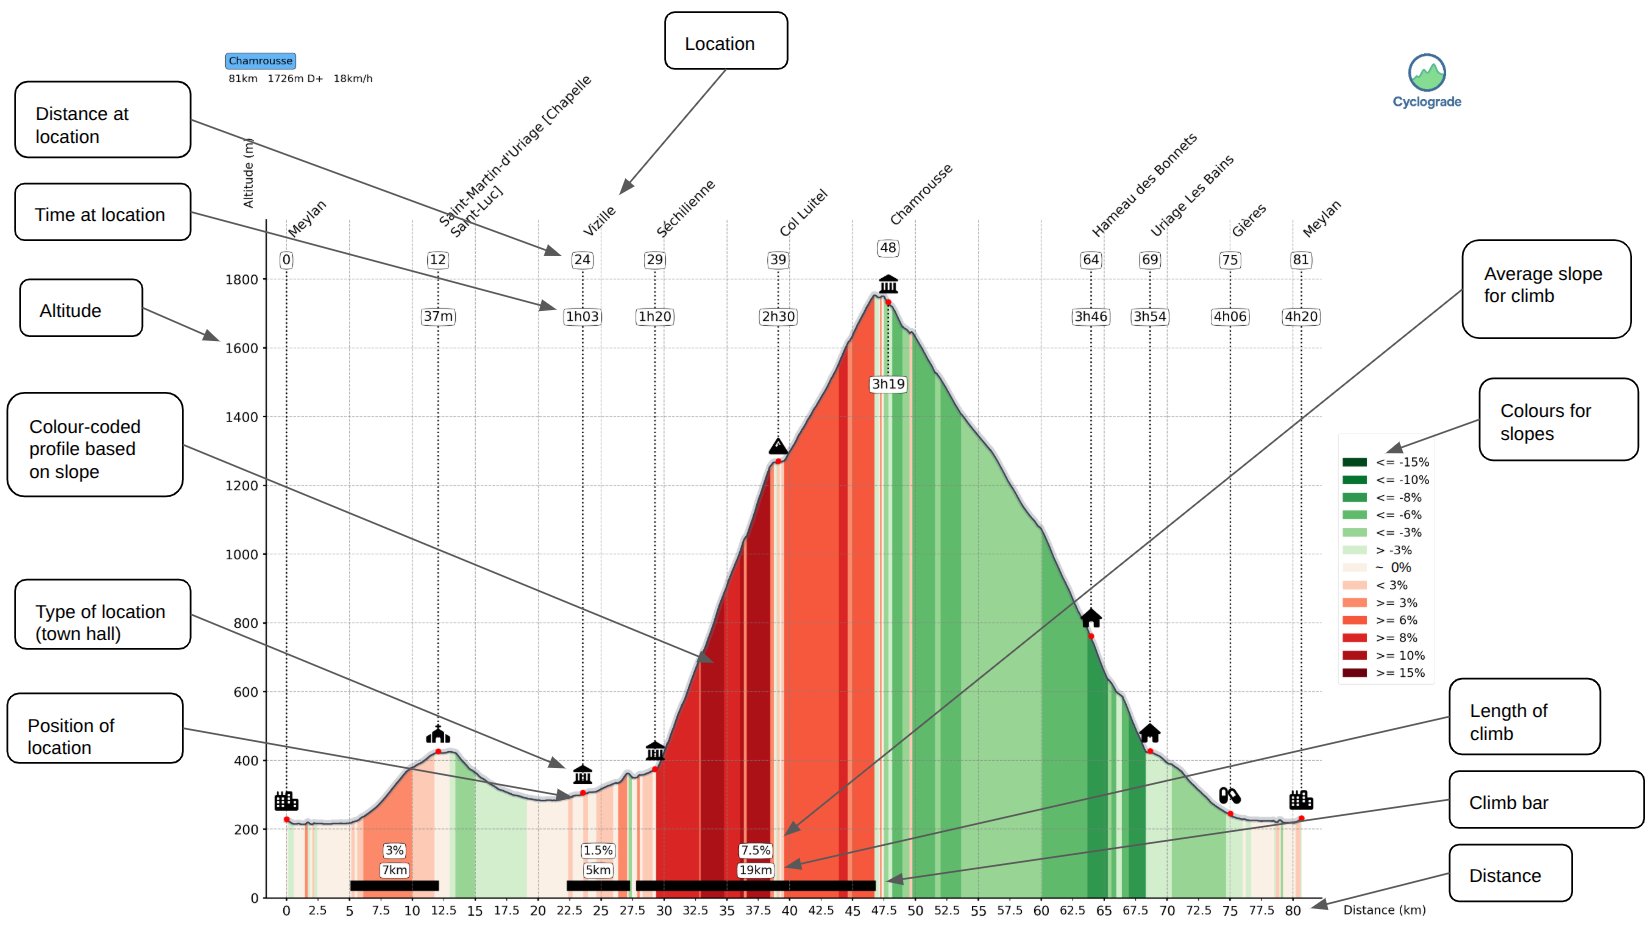
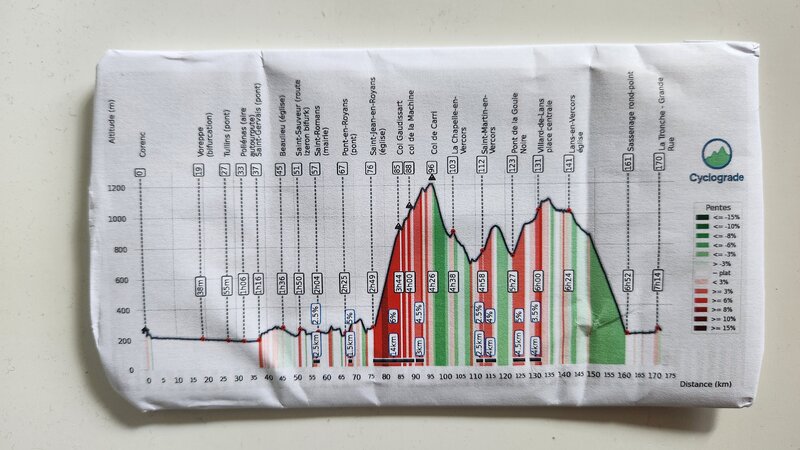
This graph shows everything Cyclograde can display on an elevation profile.
Click the image to enlarge it.
Places and passes found along the track
Estimated time at each place
Climbs found along the track
Gradients coloured by percentage
Elevation curve and gradients
The main curve shows how the elevation in metres changes with the distance covered in kilometres. The horizontal axis is distance, the vertical axis elevation. The colours under the curve tell you the gradient percentage. The legend on the right-hand side of the graph shows which colour goes with which gradient.
Places along the track
Cyclograde picks out places along the track that are easy to spot from the road, so you can follow your progress properly. The place search is based on OpenStreetMap data. Cyclograde aims for about fifteen places on a track (passes included), spread evenly by distance. Some stretches may end up with no place at all if the track crosses sparsely populated areas. You can add your own custom places from the Edit track page once the track has been created.
Place types shown on the profile
Every place found on the profile is shown by an icon. All places have a primary name, that of the city or village. Some places also have a secondary name (the name of the bar or the restaurant, for instance).
Pass
Passes are found automatically from OpenStreetMap data. They only have a primary name, the name of the pass. There is usually a sign at the top to confirm it.
Icon
Type
Primary name
Secondary name
Example
Pass
Name of the pass
—
Col de la Croix de Fer
Places in a city or a village
In cities and villages, Cyclograde looks first for a place that is easy to recognise as you ride through. The place is always visible from the road. City entry and city exit match the signs at the roadside.
Icon
Type
Primary name
Secondary name
Example
City entry
City/village
—
Albertville
City exit
City/village
—
Albertville
Town hall
City/village
—
Bourg-Saint-Maurice
Train station
City/village
—
Moûtiers
Church
City/village
Name of the church
Les Arcs [Église Saint-Jean-Baptiste]
Café, bar
City/village
Name of the café / bar
Bourg-Saint-Maurice [Café de la Gare]
Bakery
City/village
Name of the bakery
Val Thorens [La fôret noire]
Supermarket
City/village
Name of the supermarket
Moûtiers [Intermarché]
Pharmacy
City/village
—
Le Versoud
Restaurant
City/village
Name of the restaurant
Chambéry [Pizzéria Enzo]
Hotel
City/village
Name of the hotel
Albertville [Hôtel des Voyageurs]
Village / Hamlet / Isolated spot
When no specific place has been found in a city or a village, Cyclograde can fall back on a village, a hamlet or an isolated spot. The point on the profile is the centre of the place, usually easy to recognise.
Icon
Type
Primary name
Secondary name
Example
Village / Hamlet / Isolated spot
Village / hamlet / isolated spot
—
Les Plagnes
Water point, food stop and others
Cyclograde doesn't find these places automatically, but you can add them yourself by editing a track. <br/> For the sportives available in the track catalogue, the food stops are already there.
Icon
Type
Primary name
Secondary name
Example
Water point
City/village
—
Food stop
City/village
—
Bike repair
City/village
Name of the shop
Grenoble [Atelier Vélo des Alpes]
Other (flag)
City/village
(optional)
Climbs along the track
Significant climbs are found automatically and drawn as a bar covering the full length of the climb, with the average gradient and the length written next to it. Together with the gradient colours, that gives you a good idea of the effort each difficulty on the track will ask of you.
Estimated time on the track
The estimated time is worked out from the speed profile you picked, so it takes into account how the gradients affect your speed. A time is shown at every place and pass found along the track, which lets you check regularly where you stand against the total time for your ride. Ahead or behind, you can adjust your pace accordingly.
The track profile is meant to come with you: put it on your phone or print it out.
×
Edit the places on a track
The track editing page lets you change the places on your track. You can add, delete or rename one or more places.
The interactive map
The map shows your track in red. You can zoom and pan around to explore it. The zoom buttons are at the top left.
Select a point
Click anywhere on the map to select a point on the track. The nearest point on the track is picked automatically, and its coordinates show at the bottom left.
Add a place
Once a point is selected, click the "Add as a track point" button. A dialog opens where you type the place name, choose the place type and, if you want, a secondary name. A preview of the final name is shown before you confirm. If you pick a place your track goes through more than once, a dialog asks which pass you want. Passes are in track order, so on an out-and-back, pass 1 is the way out and pass 2 the way back.
Edit / delete a place
You can edit or delete a place with the edit or delete button to the right of each place, in the block listing all the places to the right of the map.
Save your changes
Once all your places are added, click "Save" to store your changes. The track is regenerated with the new places. You can also click "Cancel" to leave without saving.
Place list
The list of places you have added is shown to the right of the map. Click a number to centre the map on that place, or use the buttons to edit or delete a place.
Back to the initial view
The house icon button (⌂) at the top left takes you back to the overview of the track if you have zoomed or panned the map.
Make the track your own by renaming, removing or adding places.
Be careful not to put places too close together, and not to add too many, or the names, the distances or the times may end up overlapping. Cyclograde does its best to fit them in, but when it can't, the fix is to remove one or more places, or to spread them out better.
Edit a track's settings
The settings page lets you change the graph options of a track you've already created, without having to build it again from scratch.
Current profile preview
Before you change anything, you can look at the track's current elevation profile to decide what to change.
Change the graph options
You can change every graph option: the speed profile, the gradient model, the style, the print format and the display options. The changes have exactly the same effect as when you first created the track.
Regenerate the profile
Click "Regenerate profile" to run the elevation profile generation again with the new settings. The track is updated and the new profile replaces the old one.
Handy when you want your profile in another format (A4, smartphone, sticker) or in a different style, without rebuilding your track from scratch.
Create a speed profile
Speed profiles give you time estimates that really match what you can do. A speed profile gives your speeds by gradient. On the flat, on gentle slopes, on steep ones, and so on. In practice, every gradient percentage has a speed. For example, at 0% (on the flat) you ride at 25km/h, at 5% you ride at 16km/h, at 10% you ride at 8km/h. These are average speeds. You can create several of them to pick a different pace depending on the track. Follow the steps below to create one.
Get a reference GPX file ready
Pick a track you have already ridden at the pace you want to follow. Ideally it should cover different kinds of gradients so Cyclograde can work out your speed on all of them, but that is not compulsory: Cyclograde fills in whatever is missing. The GPX file must contain time information, otherwise no speed can be worked out.
Go to Speed profiles
In the menu, choose Speed profiles , then click the "Add a speed profile" button. You can create up to 10 different speed profiles.
Give the profile a name
Pick a descriptive name that says what kind of effort it was, and possibly the duration, the distance or the elevation gain. For example: "endurance 100km 4h" or "z4 intervals 1h30". It will help you choose the right profile for a track depending on your goal.
Upload your GPX file
Select the GPX file, then click "Generate the speed profile". Cyclograde analyses your times along the way and works out your average speed for each gradient percentage.
(Optional) Change the values in your speed profile
Once the speed profile is created, it appears in the list of your profiles. If you think some values need correcting, click the "Edit" button to adjust the speeds for each gradient by hand. The gradient percentages are fixed, you only change the speeds in km/h.
Create several profiles for different kinds of rides: endurance, hard efforts, recovery, and so on. You can then pick the profile that fits when you generate each track, and get a very accurate time estimate
Using your track profile out on the ride
The elevation profile Cyclograde builds for your track isn't just there to be looked at on a screen — it's there to come with you on the ride. Here's how to get it ready to take out on the road.
Save it on your phone (digital version)
Pick the smartphone print format and "print" the profile as PDF or PNG (both are available on the track page). Put the file on your phone and you can check it any time during your ride, even with no internet connection.
Print your profile (paper/sticker version)
You can print your profile and take it with you. Cyclograde offers several print-friendly formats so you can pick the one that suits you best. Use the Save as PDF option on the track page to be sure the profile comes out at the right size.
Size of each format
Format
Width (cm)
Height (cm)
A4 sheet
29,9
21
Smartphone landscape
15,5
7,8
Smartphone portrait
15,5
7,8
Sticker
12,7
3,56
A4 sheet
Prints on a standard A4 sheet. The profile comes out big, everything stays easy to read, and it folds into four in your back pocket.
Smartphone format
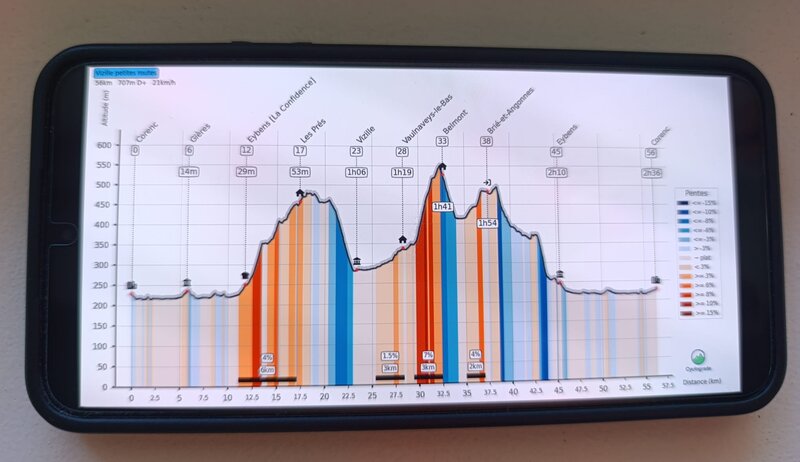
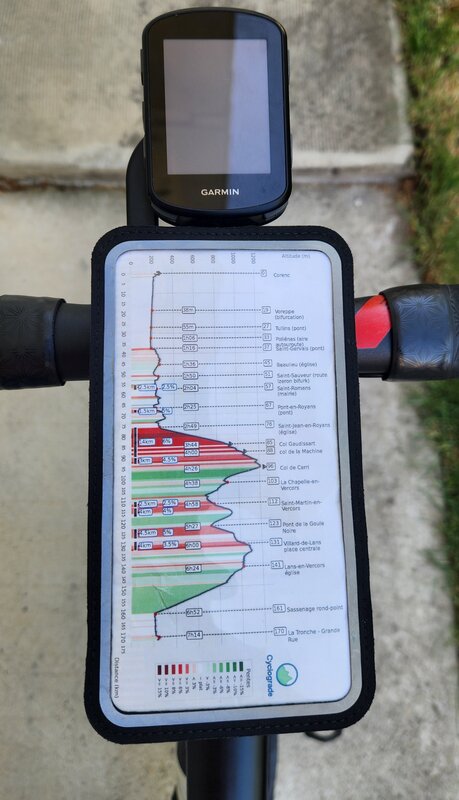
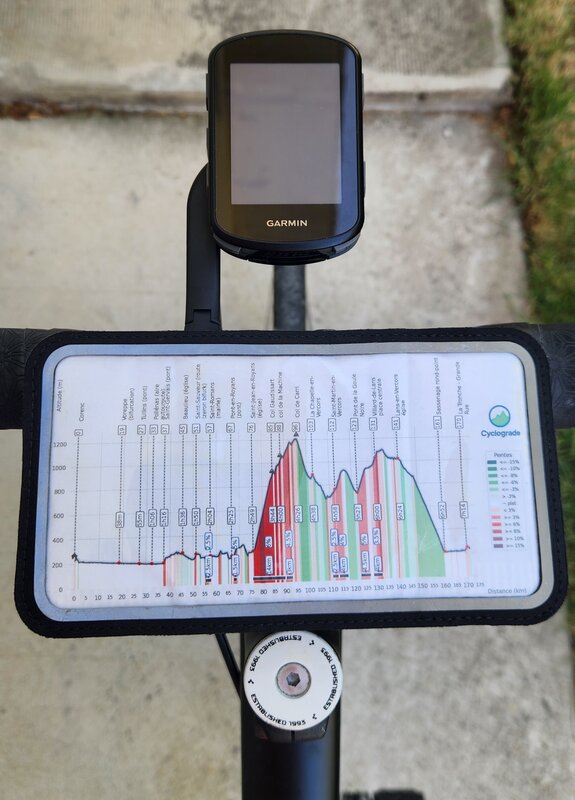
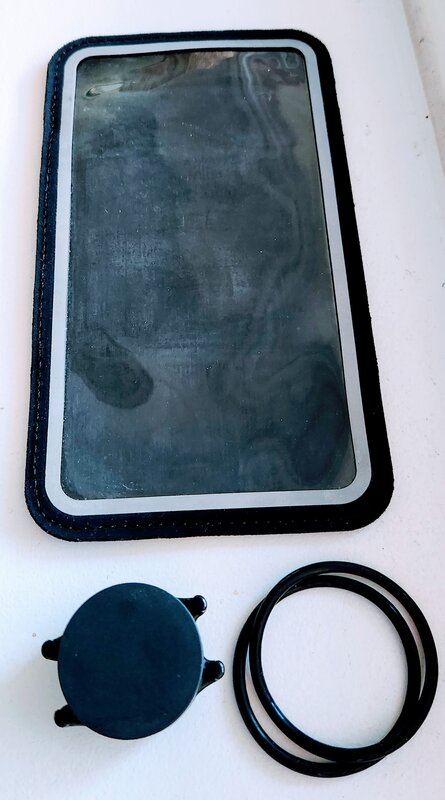
A mid-size format (landscape or portrait) that lets you clip the profile onto a bike phone mount. It's big enough to read while staying compact, and you can check your profile whenever you want. There are plenty of bike phone mounts out there, easy to find online or in any sports shop.
Sticker
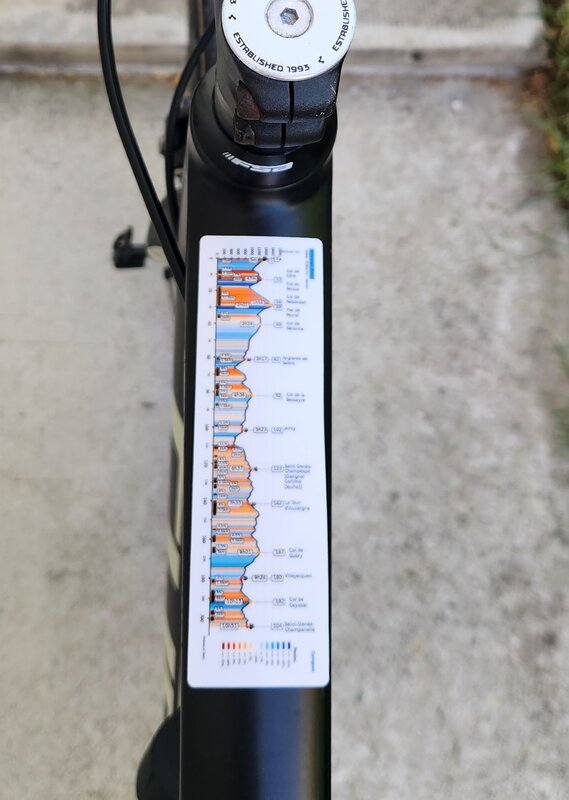
A compact format you can print as a sticker and stick on your bike's top tube. The dimensions already include a margin for printing. Always right under your eyes, and never in the way. Careful: this format is far more compact, and some of the information can be harder to read. Print the profile on paper first to check that the dimensions and the text size work for you.
For the printing itself, you can try a printer near you or an online one. Online, it's hard to find a printer willing to run off a single copy. The best I've found: PrettyGoodSticker, who charge 1 to 2 euros per sticker plus 5 to 6 euros for delivery (prices from June 2026). The site is in English only but very easy to use. You can order several different stickers, one or more copies of each. Locally, a printer charged me 6 euros for a good-quality sticker.
Try a few formats to find the one that works for you. The smartphone format is a good compromise.
Take care if you look at your profile while riding — the same as with your bike computer. Never on a descent, only at low speed, and only when there is no hazard nearby (cars, traffic lights, junctions, and so on).
Using the TCX file on your bike computer
TCX files have only been tested on Garmin bike computers. In theory it should work on Hammerhead Karoo and Lezyne units too, but there's no clear documentation on that. Wahoo units no longer support TCX — they need the FIT format (FIT support in Cyclograde is planned for a future version).
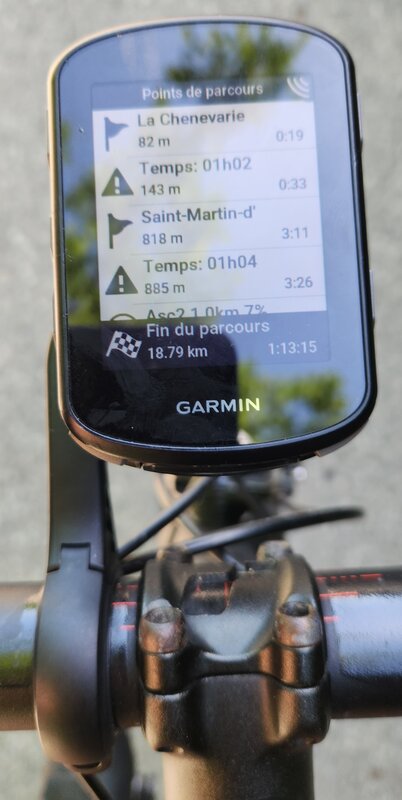
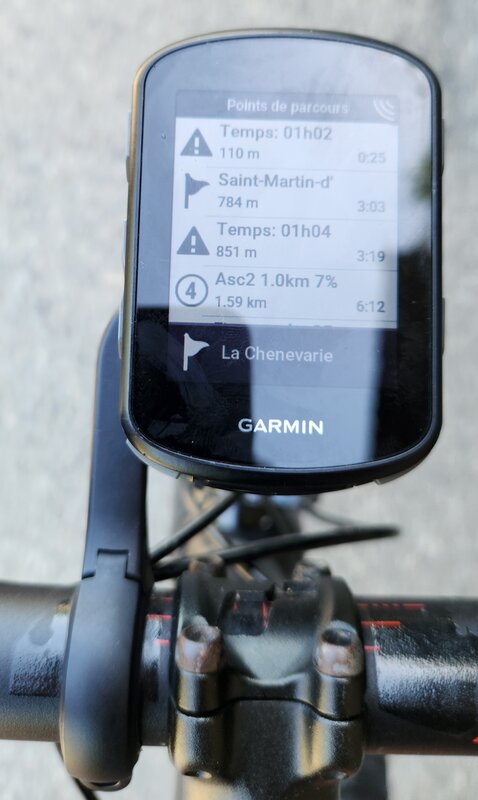
From the track page you can export the track as TCX. This format lets you define course points that your bike computer picks up to trigger alerts, which GPX can't do. Cyclograde adds course points for the places and climbs it has worked out. So your bike computer warns you about every stage as it comes, along with the matching time.
How places show up on your bike computer
For every place found on your track, your bike computer shows two alerts in a row: 1) a first one a few metres before the place, giving your estimated time there, 2) then a second one as you pass it, with its name. The text is limited to 15 characters: Cyclograde shortens long names automatically (e.g. "Col de la Madeleine" becomes "ColMadeleine").
Here are two examples of the messages shown on the bike computer: In the first one, Col de La Madeleine is place number 1, with an estimated time of 1h45 on the clock. In the second one, Albertville is place number 3, with an estimated time of 3h45 on the clock.
Col de la Madeleine (place no.1)
30 m before
Lieu 1 01h45
As you pass
1 ColMadeleine
Albertville (place no.3)
30 m before
Lieu 3 03h20
As you pass
3 Albertville
How climbs show up on your bike computer
For every climb found on the track, your bike computer shows a series of alerts so you can follow your progress up it: at the bottom, halfway up (plus at a quarter and three quarters on long climbs), and at the summit. Each alert is preceded by a time announcement a few metres earlier.
Here are the alerts shown for each climb:
Long climb (≥ 4 km) — Climb no.1
Stage
30 m before
As you pass
Start
Asc1 01h15
Asc1 9.4km 7%
25 %
Asc1 25% 01h30
Asc1 25%
50 %
Asc1 50% 01h45
Asc1 50%
75 %
Asc1 75% 02h00
Asc1 75%
Summit
Asc1 fin 02h15
Asc1 fin
Short climb (< 4 km) — Climb no.2
Stage
30 m before
As you pass
Start
Asc2 02h30
Asc2 3.2km 5%
50 %
Asc2 50% 02h45
Asc2 50%
Summit
Asc2 fin 02h55
Asc2 fin
To load the TCX file onto your Garmin, you have to copy it across over USB. Download the TCX file to your computer, plug your Garmin into it with the USB cable, and copy the TCX file into Garmin's NewFiles folder. If you sync it through Strava or Garmin Connect (and, as far as I can tell, from any other platform), every course point is stripped out and you end up with exactly what you'd have with the GPX file.
GPX file quality (elevation quality warnings)
Cyclograde automatically checks the quality of the elevation data held in each track's GPX file. When it finds a problem, an icon appears next to the track name. Here's what these icons mean, and how to fix the GPX file if you need to.
Yellow icon — noisy elevation data
The track's GPX file does have elevation data, but it's spoiled by small oscillations — a bit like a line that wobbles. This often happens with a recording from a smartphone or a low-end GPS device: the GPS signal drifts slightly all the time, which creates tiny artificial climbs and descents.
What this means: the elevation gain shown may be inflated compared with reality. The route and the distances are still correct, but this will affect the estimated time.
Red icon — broken elevation data
The track's GPX file contains serious anomalies in the elevations: long stretches with no data, a sensor stuck on a fixed value, or an abrupt jump of several tens of metres. These faults often turn up when a barometer freezes, when the track was generated without elevation data, or when a software export corrupted the file.
What this means: the elevation gain shown may be a long way off, or plain wrong. This will affect the estimated time.
Both problems are fixed the same way: replace the recorded elevations with those from a digital elevation model (DEM).
Upload your GPX file and pick a DEM elevation source (SRTM or EU-DEM, for example).
GPS Visualizer replaces the elevation data with values from the digital elevation model.
Download the corrected file as GPX and upload it to Cyclograde.
Any other tool that can replace the elevations in a GPX file with those from a digital elevation model (DEM) will do just as well. GPS Visualizer is suggested because it's free and it solves the problem - Cyclograde has no connection with that site.
Special case: going through tunnels
When a track goes through a tunnel, the GPS loses the satellite signal and records wrong or missing elevation data. These anomalies trigger the red icon (broken elevation data) for the sections concerned.
Correcting with a digital elevation model (DEM) doesn't work in this case: the DEM gives the elevation of the ground surface, not that of an underground passage. So there will always be elevation errors for these sections — that's an inherent limitation of GPS data in tunnels.
The pages of the site
Cyclograde has several pages to manage your tracks and speed profiles. Here's a quick tour of each one.
Home
The home page introduces Cyclograde and what it can do. It's the starting point for getting to know the site.
Tracks
This page lists all your saved tracks. You get an overview of each one (name, distance, elevation gain, estimated time) and the actions you can take: view the track in detail, edit its places, or delete it.
New track
This page lets you generate a new elevation profile by setting all the options: name, GPX file, speed profile, style, print format and display options.
Track catalogue
This page lists all the published tracks available in the catalogue. You can filter them by type and by area, check the stats for each one, and pick one to generate your own customised profile.
Customise a track from the catalogue
This page lets you customise a track you've picked from the catalogue: give it a name, choose your graph options, and generate your elevation profile. The GPX file comes with the catalogue track automatically.
View a track
This page shows everything about a track: an interactive map with the track drawn on it, the generated elevation profile, the stats, and the details of every climb.
Edit track
This page lets you add your own places to a track. Click on the map to pick a point, fill in the place name and the place type, then confirm to regenerate the profile with the new places.
Edit track settings
This page lets you change the graph settings of an existing track (speed profile, gradient model, style, print format, display options) and regenerate the profile without having to recreate the track from scratch.
Speed profiles
This page lists all your custom speed profiles (10 at most). You can see the speeds for each gradient band, edit a profile, delete one, or create a new one from a track you've really ridden.
Edit speed profile
This page lets you edit the speeds in your profile by hand, for each gradient band. The gradient percentages are fixed; you only change the speeds in km/h.
Help
The help page you're reading right now.
About
This page explains where Cyclograde came from.
Contact
This page lets you get in touch with the Cyclograde admin with any question or suggestion.